Q&A 4 How do you query a country’s GDP trend over time?
4.1 Explanation
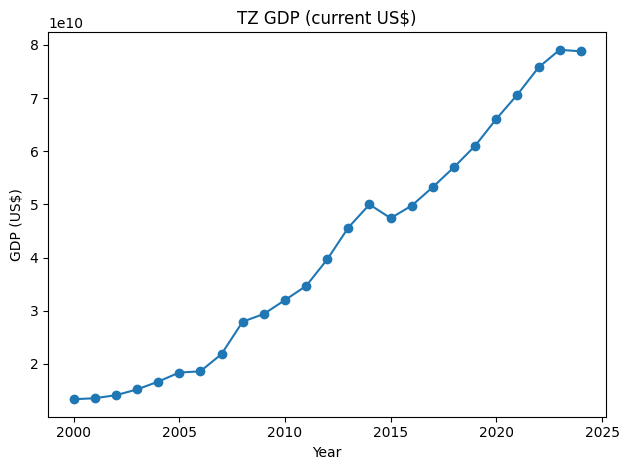
Once the data is validated, the next step is to look at a single-country time series to understand how GDP evolves year by year. This confirms that your queries and plots work correctly before scaling to multiple countries.
4.3 Python Code
# Plot GDP trend for a chosen country using pandas + SQLAlchemy
import os
import pandas as pd
import matplotlib.pyplot as plt
from sqlalchemy import create_engine, text

# Connection
user = os.getenv("DB_USER", "root")
pwd  = os.getenv("DB_PASS", "")
host = os.getenv("DB_HOST", "127.0.0.1")
port = int(os.getenv("DB_PORT", "3306"))
db   = os.getenv("DB_NAME", "cdi_economics")
engine = create_engine(f"mysql+pymysql://{user}:{pwd}@{host}:{port}/{db}")

# Choose a country (ISO3 code)
country_code = "TZ"

with engine.connect() as conn:
    df = pd.read_sql(text(f"""
        SELECT year, gdp_usd_current
        FROM gdp_wdi
        WHERE country = '{country_code}'
        ORDER BY year;
    """), conn)

# Clean and plot
df = df.dropna(subset=["gdp_usd_current"]).sort_values("year")

plt.figure()
plt.plot(df["year"], df["gdp_usd_current"], marker="o")
plt.title(f"{country_code} GDP (current US$)")
plt.xlabel("Year")
plt.ylabel("GDP (US$)")
plt.tight_layout()
plt.show()