Q&A 10 How do I visualize GDP levels and GDP growth factors?
10.1 Explanation
Tables are useful for queries, but visualizations make trends and patterns clearer.
With GDP data, two simple plots are especially useful:
- Line plots → show GDP trends over time
- Bar plots or scatter plots → show relationships between GDP growth and explanatory factors
10.2 SQL/MySQL Code
SQL itself is not designed for plotting, but you can query data and export it into Python or a visualization tool.
10.3 Python Code
Using pandas + matplotlib for quick plots:
import pandas as pd
import matplotlib.pyplot as plt

# Load datasets
gdp = pd.read_csv("data/gdp_wdi_EAC_USA_2000_2024.csv")
factors = pd.read_csv("data/gdp_growth_factor.csv")

# --- Plot 1: GDP levels for KE, TZ, UG
subset = gdp[gdp["country"].isin(["KE","TZ","UG"])].sort_values(["country","year"])
pivot = subset.pivot(index="year", columns="country", values="gdp_usd_current")

plt.figure(figsize=(10,6))
pivot.plot(ax=plt.gca(), marker="o")
plt.title("GDP Levels (2000–2024): Kenya, Tanzania, Uganda")
plt.ylabel("GDP (current US$)")
plt.xlabel("Year")
plt.grid(True, linestyle="--", alpha=0.6)
plt.legend(title="Country")
plt.tight_layout()
plt.show()

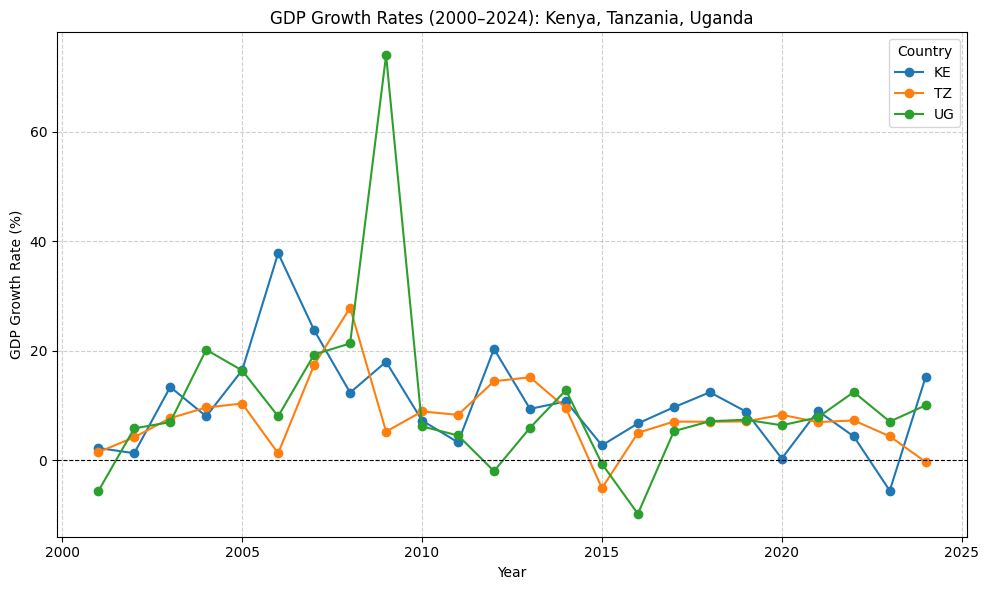
# --- Plot 2: GDP growth rates for KE, TZ, UG
# (using gdp_wdi table directly: compute % change)
subset["gdp_growth_rate"] = subset.groupby("country")["gdp_usd_current"].pct_change() * 100
pivot_growth = subset.pivot(index="year", columns="country", values="gdp_growth_rate")

plt.figure(figsize=(10,6))
pivot_growth.plot(ax=plt.gca(), marker="o")
plt.title("GDP Growth Rates (2000–2024): Kenya, Tanzania, Uganda")
plt.ylabel("GDP Growth Rate (%)")
plt.xlabel("Year")
plt.axhline(0, color="black", linestyle="--", linewidth=0.8)
plt.grid(True, linestyle="--", alpha=0.6)
plt.legend(title="Country")
plt.tight_layout()
plt.show()